Corporations are increasingly attuned to the influence of human activity on land use, land use changes and forestry (see LUC Guidance). With systemic thinking, businesses are aware of their supply chain’s impact and they seek additional guidance to fully integrate biodiversity gains and losses in their environmental decision-making. Forestry in particular exerts pressures on biodiversity, which are not fully accounted for in current life cycle inventories and impact assessment methodologies. As a result, life cycle assessments (LCA) strive to appropriately differentiate sustainably managed forests from the rest in terms of their impact on biodiversity. As Quantis aims to combine the latest science and effective business solutions, one of our experts, Vincent Rossi, contributed to a new methodological development and considers what remains to be done.
Introducing an alternative methodology
The issue with biodiversity accounting in LCA arose from a discrepancy between available impact assessment methods and the occupation inventory data – and ultimately, lacking data. Biodiversity assessments indeed depend on qualitative and quantitative components; while qualitative databases are on hand, quantitative information is inherently tied to location.
A direct approach would measure how biodiversity is impacted by human activities and therefore rely on field observations. While this minutely reflects a given sample’s biodiversity levels, it requires extensive data collection efforts. An alternative is to focus on the pressures exerted by forestry practices on key biodiversity state indicators. To that end, a hemeroby level is used to calculate distance to a “virgin state”, acting as a proxy for the Conditions for Maintained Biodiversity Index. Expanding from current frameworks, the novelty of this method lies in allotting a specific hemeroby level to each state indicator.
A 3-layered valuation approach
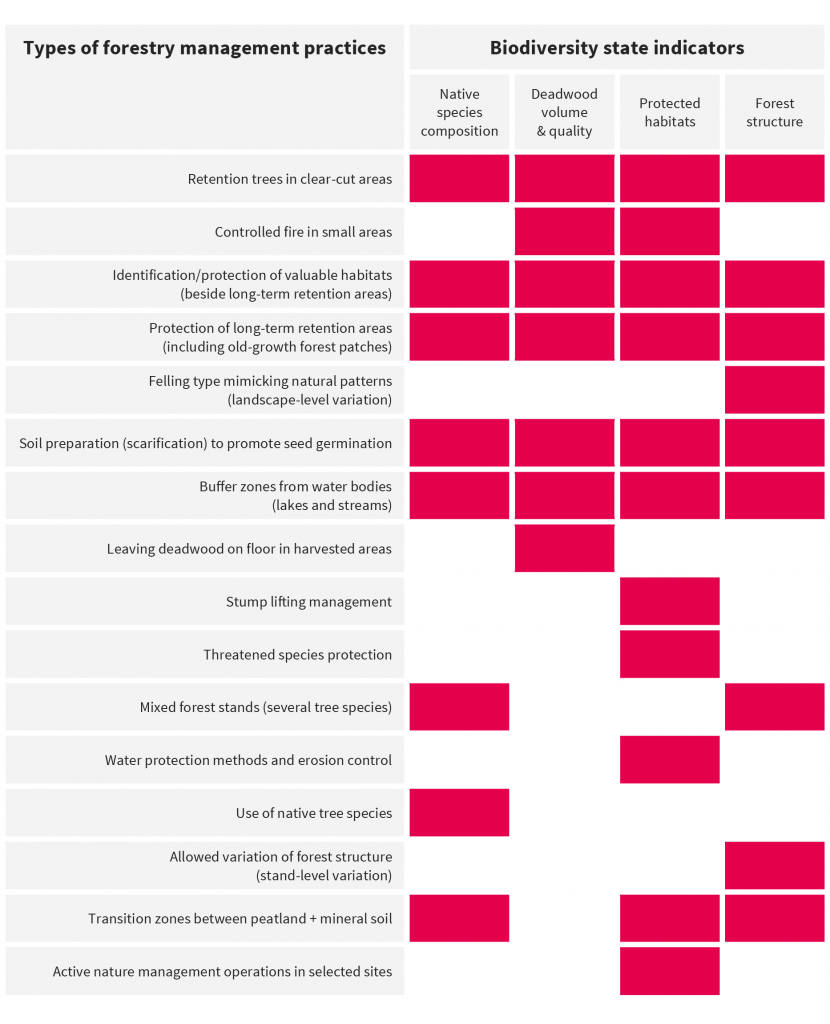
The method zeroes in on the quantitative and qualitative assessment of 16 types of forestry management practices, selected for their influence on habitat development and biodiversity (see table 1).
Table 1 – Forestry management practices and their impact on 1 or several of 4 biodiversity state indicators.

Based on the relevant hemeroby levels, partial biodiversity scores are aggregated into a single indicator:
1+ Partial biodiversity scores
For each biodiversity state indicator, a partial biodiversity function is generated independently, where ahemeroby level corresponds to a given partial biodiversity score. Partial biodiversity functions are determined by forest sensitivity to each type of change.
2+ Combined partial biodiversity scores
These scores are then aggregated as a biodiversity potential (BP), with reflects the interrelations and dependencies between different components of the ecosystem. Indicators are implicitly weighted so that the lower they are, the more impactful they are for biodiversity as a whole.
3+ Zeroing in on a midpoint indicator and potentially disappeared fraction
This BP stands for the remaining fraction of the naturally occurring species of the local biodiversity, based on the corresponding hemeroby levels. The resulting approximated lost fraction constitutes a midpoint biodiversity indicator and corresponds to the potentially disappeared fraction more commonly used in LCA.
Current limits and further developments
The hemeroby levels of each biodiversity state indicator are based on benchmarks – and therefore not exhaustive. Likewise, the proposed partial biodiversity functions are based on best available estimates and would need to be adapted according to practice and ongoing comparison with field measurements.
Further down the line, the influence of surrounding ecosystems may be included in terms of their compatibility with the exploitation under study. This step would prove essential for this method to be applicable to plantations at the landscape level (especially in other biomes), as their impact on biodiversity is largely driven by whether or not they are subject to protection, particularly in areas of high biodiversity value. An additional state indicator may be introduced to describe biodiversity resilience in relations to surrounding ecosystems: it is not currently included in the proposed methodology, as it is still subject to ongoing research.
The methodology co-developed by Quantis shows LCA practitioners typically underestimate the biodiversity impacts of forestry. It also advantageously combines limited data collection requirements and greater insights into the biodiversity impacts of wood products generated through contrasting forestry practices.
Based on a boreal forestry sample, the methodology is readily applicable and was put to the test in the context of Nestlé and UPM operations. Looking to the future, the goal is for biodiversity evaluations to approach the refinement of field measurements and eventually be adapted in other climates or types of land use.
For more information on forestry impacts on biodiversity or to learn about the methodology, please contact Vincent Rossi.
1. Rossi, V.; Lehesvirta, T.; Schenker, U.; Lundquist, L.; Koski, O.; Gueye, S.; Taylor, R.; Humbert, S. (2017), Land use in LCA: Capturing the potential biodiversity effects of forestry practices in life cycle assessments, International Journal of Life Cycle Assessment, 1 – 9.
2. The World Wildlife Fund (2015), WildFinder: Online database of species distributions, www.worldwildlife.org/wildfinder, accessed 25, Nov 2015.
3. Hemeroby is defined as a habitat’s “departure from a state of naturalness”. Hemeroby is a feature of the plant population or species and describes the level of human impact on their habitats and ultimately, their tolerance to it – see Brentrup, F.; Küsters, J.; Lammel, J.; Kuhlmann, H. (2002), Life cycle impact assessment of land use based on the hemeroby concept, International Journal of Life Cycle Assessment (7), 339 – 348.
4. Lindner, J.P.; Niblick, B.; Eberle, U. et al. (2014), Proposal of a unified biodiversity impact assessment method, StartFragment 9th International Conference LCA of Food, San Francisco, USA.
Get the latest insights, trends, and innovations to help position yourself at the forefront of sustainable business leadership—delivered straight to your inbox.
Sustainable Brands Staff
Published Oct 16, 2017 12pm EDT / 9am PDT / 5pm BST / 6pm CEST